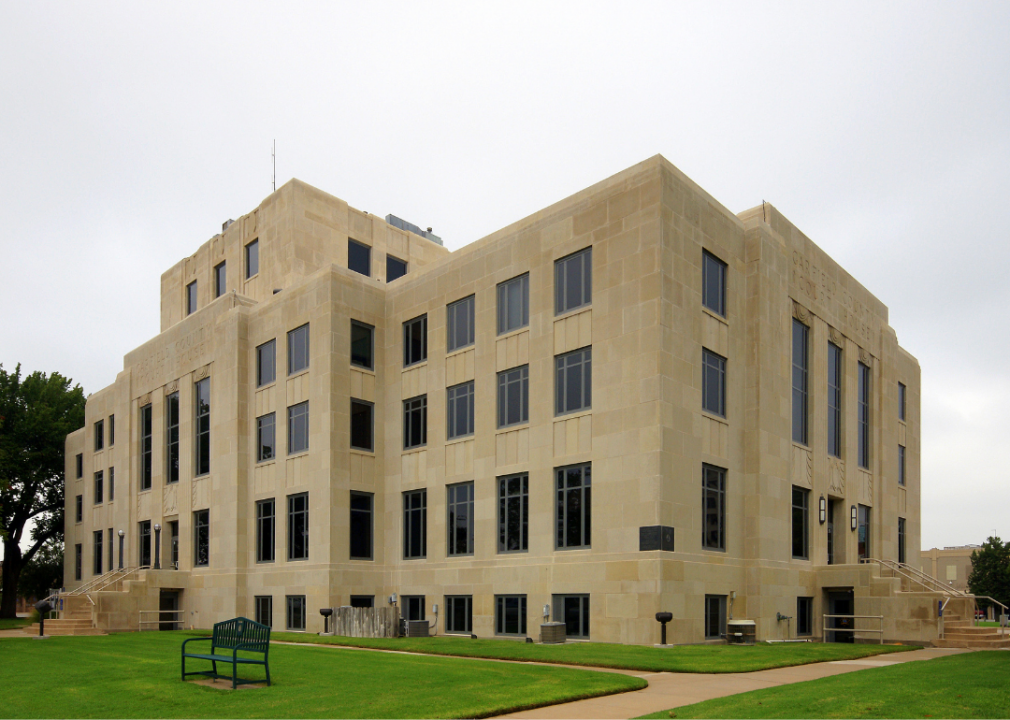
Fastest-Growing Counties In Oklahoma
Stacker has complied a list of the fastest growing counties in the state of Oklahoma.Monday, June 14th 2021, 6:55 am
Written by: Stacker
From 2018 to 2019, the U.S. population grew by .48%, its slowest rate in 100 years. Declining births, increasing deaths largely due to the graying Baby Boomer population, and a crackdown on immigration have contributed to many states seeing net population losses in recent years.
But in other pockets of the country, populations are growing. These shifts can be due to job opportunities, high quality of life, easy commutability to job centers, low rents, or any combination of these or other factors. Stacker compiled a list of the fastest-growing counties in Oklahoma using data from the U.S. Census Bureau. Counties are ranked by the highest population growth from 2010 to 2019, based on 5-year estimates.
A county typically sees population growth as a “bedroom community” (a municipality with an atypically large commuting population) to a large city. These communities are typically quieter than their feeder cities, offer lower rents and a higher quality of living, and are remote enough to be immune to the feeder city’s crime, traffic, and crowds. Keep reading to see if your home county made the list.
 Zeugzeug // Wikimedia Commons
#30. Woods County
- 2010 to 2019 population change: +387
--- #1,215 among all counties nationwide
- 2010 to 2019 percent population change: +4.5%
--- #22 among counties in Oklahoma, #859 among all counties nationwide
- 2019 population: 9,043
--- #61 largest county in Oklahoma, #2,498 largest county nationwide
#29. Beckham County
- 2010 to 2019 population change: +451
--- #1,180 among all counties nationwide
- 2010 to 2019 percent population change: +2.1%
--- #35 among counties in Oklahoma, #1,199 among all counties nationwide
- 2019 population: 22,268
--- #38 largest county in Oklahoma, #1,717 largest county nationwide
#28. Murray County
- 2010 to 2019 population change: +753
--- #1,052 among all counties nationwide
- 2010 to 2019 percent population change: +5.7%
--- #16 among counties in Oklahoma, #728 among all counties nationwide
- 2019 population: 13,946
--- #48 largest county in Oklahoma, #2,165 largest county nationwide Melodibit // Wikimedia Commons
#27. Love County
- 2010 to 2019 population change: +757
--- #1,051 among all counties nationwide
- 2010 to 2019 percent population change: +8.1%
--- #10 among counties in Oklahoma, #528 among all counties nationwide
- 2019 population: 10,063
--- #59 largest county in Oklahoma, #2,424 largest county nationwide Canva
Canva
#26. Woodward County
- 2010 to 2019 population change: +760
--- #1,050 among all counties nationwide
- 2010 to 2019 percent population change: +3.8%
--- #27 among counties in Oklahoma, #940 among all counties nationwide
- 2019 population: 20,727
--- #41 largest county in Oklahoma, #1,788 largest county nationwide MARELBU // Wikimedia Commons
#25. Kingfisher County
- 2010 to 2019 population change: +918
--- #1,002 among all counties nationwide
- 2010 to 2019 percent population change: +6.2%
--- #15 among counties in Oklahoma, #674 among all counties nationwide
- 2019 population: 15,694
--- #45 largest county in Oklahoma, #2,056 largest county nationwide Ammodramus // Wikimedia Commons
#24. Texas County
- 2010 to 2019 population change: +979
--- #978 among all counties nationwide
- 2010 to 2019 percent population change: +4.9%
--- #19 among counties in Oklahoma, #806 among all counties nationwide
- 2019 population: 20,805
--- #40 largest county in Oklahoma, #1,784 largest county nationwide Canva
Canva
#23. Marshall County
- 2010 to 2019 population change: +1,040
--- #966 among all counties nationwide
- 2010 to 2019 percent population change: +6.7%
--- #14 among counties in Oklahoma, #631 among all counties nationwide
- 2019 population: 16,505
--- #43 largest county in Oklahoma, #2,009 largest county nationwide kennethaw88 // Wikimedia Commons
#22. Lincoln County
- 2010 to 2019 population change: +1,072
--- #955 among all counties nationwide
- 2010 to 2019 percent population change: +3.2%
--- #30 among counties in Oklahoma, #1,023 among all counties nationwide
- 2019 population: 34,895
--- #30 largest county in Oklahoma, #1,304 largest county nationwide Michael Barera // Wikimedia Commons
#21. Carter County
- 2010 to 2019 population change: +1,326
--- #900 among all counties nationwide
- 2010 to 2019 percent population change: +2.8%
--- #32 among counties in Oklahoma, #1,083 among all counties nationwide
- 2019 population: 48,319
--- #17 largest county in Oklahoma, #1,014 largest county nationwide cher1127 // Wikimedia Commons
#20. Delaware County
- 2010 to 2019 population change: +1,416
--- #884 among all counties nationwide
- 2010 to 2019 percent population change: +3.5%
--- #29 among counties in Oklahoma, #987 among all counties nationwide
- 2019 population: 42,433
--- #24 largest county in Oklahoma, #1,123 largest county nationwide Canva
Canva
#19. Washington County
- 2010 to 2019 population change: +1,547
--- #848 among all counties nationwide
- 2010 to 2019 percent population change: +3.1%
--- #31 among counties in Oklahoma, #1,037 among all counties nationwide
- 2019 population: 51,886
--- #14 largest county in Oklahoma, #958 largest county nationwide Canva
Canva
#18. Pontotoc County
- 2010 to 2019 population change: +1,711
--- #818 among all counties nationwide
- 2010 to 2019 percent population change: +4.7%
--- #21 among counties in Oklahoma, #836 among all counties nationwide
- 2019 population: 38,355
--- #29 largest county in Oklahoma, #1,217 largest county nationwide RaksyBH // Shutterstock
#17. Comanche County
- 2010 to 2019 population change: +1,860
--- #796 among all counties nationwide
- 2010 to 2019 percent population change: +1.6%
--- #36 among counties in Oklahoma, #1,279 among all counties nationwide
- 2019 population: 121,762
--- #5 largest county in Oklahoma, #516 largest county nationwide Jeffrey Beall // Wikimedia Commons
#16. Custer County
- 2010 to 2019 population change: +2,328
--- #729 among all counties nationwide
- 2010 to 2019 percent population change: +8.7%
--- #9 among counties in Oklahoma, #493 among all counties nationwide
- 2019 population: 29,152
--- #34 largest county in Oklahoma, #1,454 largest county nationwide Caleb Long // Wikimedia Commons
#15. Cherokee County
- 2010 to 2019 population change: +2,482
--- #711 among all counties nationwide
- 2010 to 2019 percent population change: +5.4%
--- #17 among counties in Oklahoma, #755 among all counties nationwide
- 2019 population: 48,664
--- #16 largest county in Oklahoma, #1,010 largest county nationwide Melodibit // Wikimedia Commons
#14. Creek County
- 2010 to 2019 population change: +2,513
--- #708 among all counties nationwide
- 2010 to 2019 percent population change: +3.6%
--- #28 among counties in Oklahoma, #964 among all counties nationwide
- 2019 population: 71,427
--- #10 largest county in Oklahoma, #756 largest county nationwide Canva
Canva
#13. Garfield County
- 2010 to 2019 population change: +2,805
--- #682 among all counties nationwide
- 2010 to 2019 percent population change: +4.7%
--- #20 among counties in Oklahoma, #825 among all counties nationwide
- 2019 population: 61,898
--- #12 largest county in Oklahoma, #848 largest county nationwide Small Town OK // Wikimedia Commons
#12. Pottawatomie County
- 2010 to 2019 population change: +3,403
--- #633 among all counties nationwide
- 2010 to 2019 percent population change: +4.9%
--- #18 among counties in Oklahoma, #805 among all counties nationwide
- 2019 population: 72,154
--- #9 largest county in Oklahoma, #750 largest county nationwide Crimsonedge34 // Wikimedia Commons
#11. Grady County
- 2010 to 2019 population change: +3,526
--- #622 among all counties nationwide
- 2010 to 2019 percent population change: +6.8%
--- #13 among counties in Oklahoma, #621 among all counties nationwide
- 2019 population: 55,071
--- #13 largest county in Oklahoma, #923 largest county nationwide Michael Barera // Wikimedia Commons
#10. Bryan County
- 2010 to 2019 population change: +5,262
--- #529 among all counties nationwide
- 2010 to 2019 percent population change: +12.8%
--- #5 among counties in Oklahoma, #260 among all counties nationwide
- 2019 population: 46,457
--- #20 largest county in Oklahoma, #1,041 largest county nationwide Canva
Canva
#9. Payne County
- 2010 to 2019 population change: +6,128
--- #495 among all counties nationwide
- 2010 to 2019 percent population change: +8.1%
--- #11 among counties in Oklahoma, #532 among all counties nationwide
- 2019 population: 81,815
--- #7 largest county in Oklahoma, #691 largest county nationwide David Dobbs // Wikimedia Commons
#8. McClain County
- 2010 to 2019 population change: +6,140
--- #492 among all counties nationwide
- 2010 to 2019 percent population change: +18.5%
--- #2 among counties in Oklahoma, #119 among all counties nationwide
- 2019 population: 39,247
--- #27 largest county in Oklahoma, #1,194 largest county nationwide Canva
Canva
#7. Rogers County
- 2010 to 2019 population change: +6,309
--- #486 among all counties nationwide
- 2010 to 2019 percent population change: +7.4%
--- #12 among counties in Oklahoma, #574 among all counties nationwide
- 2019 population: 91,353
--- #6 largest county in Oklahoma, #643 largest county nationwide Steven C. Price // Wikimedia Commons
#6. Logan County
- 2010 to 2019 population change: +6,906
--- #470 among all counties nationwide
- 2010 to 2019 percent population change: +17.4%
--- #3 among counties in Oklahoma, #143 among all counties nationwide
- 2019 population: 46,683
--- #19 largest county in Oklahoma, #1,036 largest county nationwide Canva
Canva
#5. Wagoner County
- 2010 to 2019 population change: +8,726
--- #424 among all counties nationwide
- 2010 to 2019 percent population change: +12.4%
--- #6 among counties in Oklahoma, #277 among all counties nationwide
- 2019 population: 78,958
--- #8 largest county in Oklahoma, #707 largest county nationwide MisterBadmoon // Wikimedia Commons
#4. Canadian County
- 2010 to 2019 population change: +30,641
--- #177 among all counties nationwide
- 2010 to 2019 percent population change: +27.9%
--- #1 among counties in Oklahoma, #44 among all counties nationwide
- 2019 population: 140,455
--- #4 largest county in Oklahoma, #459 largest county nationwide Michael Barera // Wikimedia Commons
#3. Cleveland County
- 2010 to 2019 population change: +32,443
--- #166 among all counties nationwide
- 2010 to 2019 percent population change: +13.1%
--- #4 among counties in Oklahoma, #245 among all counties nationwide
- 2019 population: 279,274
--- #3 largest county in Oklahoma, #246 largest county nationwide Caleb Long // Wikimedia
#2. Tulsa County
- 2010 to 2019 population change: +56,662
--- #92 among all counties nationwide
- 2010 to 2019 percent population change: +9.6%
--- #8 among counties in Oklahoma, #427 among all counties nationwide
- 2019 population: 646,419
--- #2 largest county in Oklahoma, #103 largest county nationwide Greater Oklahoma City Convention and Visitors Bureau // Wikimedia Commons
#1. Oklahoma County
- 2010 to 2019 population change: +83,193
--- #57 among all counties nationwide
- 2010 to 2019 percent population change: +11.8%
--- #7 among counties in Oklahoma, #306 among all counties nationwide
- 2019 population: 787,216
--- #1 largest county in Oklahoma, #80 largest county nationwide
More Like This
June 14th, 2021
March 11th, 2024
December 1st, 2023
November 2nd, 2023
Top Headlines
April 19th, 2024


