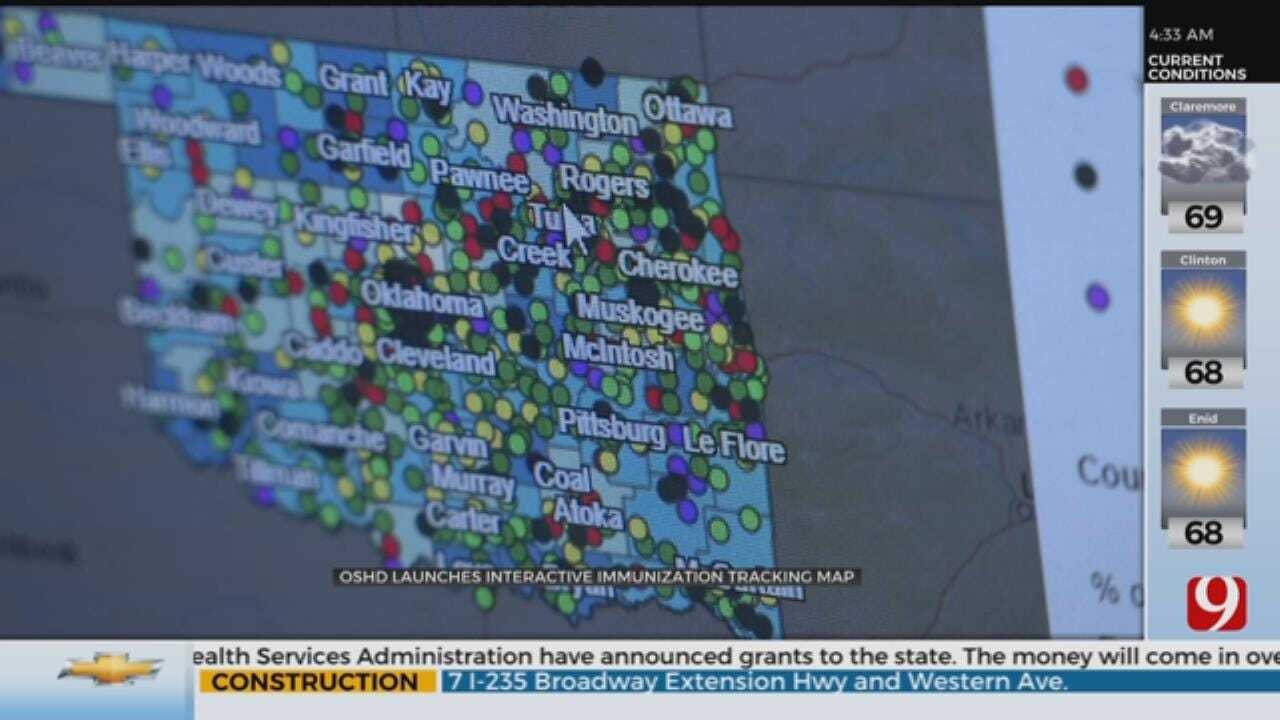
OSHD Launches Interactive Immunization Tracking Map
Parents can now see vaccine rates at all elementary schools thanks to the state department of health. This all started with a statewide volunteer vaccination survey that focused on kindergartners with about a 92-percent response rate. The state health depThursday, September 5th 2019, 11:19 am
Parents can now see vaccine rates at all elementary schools thanks to the state department of health.
This all started with a statewide volunteer vaccination survey that focused on kindergartners with about a 92-percent response rate. The state health department used all of that information to make a complete interactive map.
The map breaks down the immunization rates first by the county, and then you can zoom even closer to see the rates of every elementary school in your district.
As you click on your specific school it shows how many students completed the survey, and what percentage of kindergarten students are up to date on multiple vaccines. This including Hepatitis A, Hepatitis B, Polio and MMR. The map also shows how many students opted out of immunizations for the year.
The State Health Department said they believe making this interactive map was important because it helps them be more transparent with the availability of immunization rates, while a the same time showing where some counties and districts need to improve.
"Really in public health, this map is going to be very helpful in assessing regions of the state that have really good vaccination
rates and maybe some regions of the state where we can see some room for improvement," says Mike Mannell at the State Health Department.
The immunization data collected reflects the 2018-2019 school year, and the state says they hope this interactive map will encourage more parents to volunteer their students for future years as well.
Click here to look at the interactive map.

Get The Daily Update!
Be among the first to get breaking news, weather, and general news updates from News 9 delivered right to your inbox!
More Like This
September 5th, 2019
March 22nd, 2024

March 14th, 2024

February 9th, 2024
Top Headlines

April 19th, 2024

April 19th, 2024

April 19th, 2024