No statistically significant warming since 1995: a quick mathematical proof
No statistically significant warming since 1995: a quick mathematical proof.Sunday, December 27th 2009, 8:24 am

No statistically significant warming since 1995: a quick mathematical proof
Physicist Luboš Motl of The Reference Frame demonstrates how easy it is to show that there is: No statistically significant warming since 1995
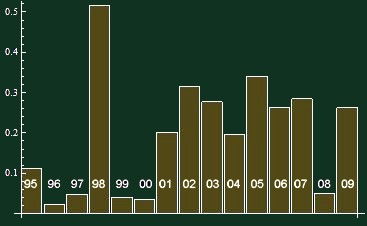
First, since it wasn't in his original post, here is the UAH data plotted:

By: Luboš Motl
Because there has been some confusion – and maybe deliberate confusion – among some (alarmist) commenters about the non-existence of a statistically significant warming trend since 1995, i.e. in the last fifteen years, let me dedicate a full article to this issue.
I will use the UAH temperatures whose final 2009 figures are de facto known by now (with a sufficient accuracy) because UAH publishes the daily temperatures, too:
Mathematica can calculate the confidence intervals for the slope (warming trend) by concise commands. But I will calculate the standard error of the slope manually.
x = Table[i, {i, 1995, 2009}] y = {0.11, 0.02, 0.05, 0.51, 0.04, 0.04, 0.2, 0.31, 0.28, 0.19, 0.34, 0.26, 0.28, 0.05, 0.26}; data = Transpose[{x, y}] (* *) n = 15 xAV = Total[x]/n yAV = Total[y]/n xmav = x - xAV; ymav = y - yAV; lmf = LinearModelFit[data, xvar, xvar]; Normal[lmf] (* *) (* http://stattrek.com/AP-Statistics-4/Estimate-Slope.aspx?Tutorial=AP *) ;slopeError = Sqrt[Total[ymav^2]/(n - 2)]/Sqrt[Total[xmav^2]] The UAH 1995-2009 slope was calculated to be 0.95 °C per century. And the standard deviation of this figure, calculated via the standard formula on this page, is 0.88 °C/century. So this suggests that the positivity of the slope is just a 1-sigma result – a noise. Can we be more rigorous about it? You bet.
The 99% confidence interval is (-1.59, +3.49) in °C/century. Similarly, the 95% confidence interval for the slope is (-0.87, 2.8) in °C/century. On the other hand, the 90% confidence interval is (-0.54, 2.44) in °C/century. All these intervals contain both negative and positive numbers. No conclusion about the slope can be made on either 99%, 95%, and not even 90% confidence level.
Only the 72% confidence interval for the slope touches zero. It means that the probability that the underlying slope is negative equals 1/2 of the rest, i.e. a substantial 14%.
We can only say that it is "somewhat more likely than not" that the underlying trend in 1995-2009 was a warming trend rather than a cooling trend. Saying that the warming since 1995 was "very likely" is already way too ambitious a goal that the data don't support.

Get The Daily Update!
Be among the first to get breaking news, weather, and general news updates from News 9 delivered right to your inbox!
More Like This

December 27th, 2009

March 22nd, 2024

March 14th, 2024

February 9th, 2024
Top Headlines


April 18th, 2024

April 18th, 2024
